Integration Logs UI
Integration logs are invaluable to developers as they provide detailed records of interactions between various components of a software system, enabling efficient troubleshooting and debugging. These logs capture the flow of data and execution across integrated systems, highlighting errors, performance bottlenecks, and unexpected behaviors. By analyzing IFX integration logs, developers can quickly pinpoint issues, understand the context of failures, and ensure smooth communication between different services, ultimately accelerating the development process and improving software reliability.
IFX historically offered an API for accessing logs and now hosts a UI that makes accessing your integration logs even easier.
While the API is still available, we have created an improved experience for viewing integration logs easily without firing a single cURL command. Simplifying this process reduces the time required for developers to view necessary logs and provides a better developer experience.
Where to find the logs UI
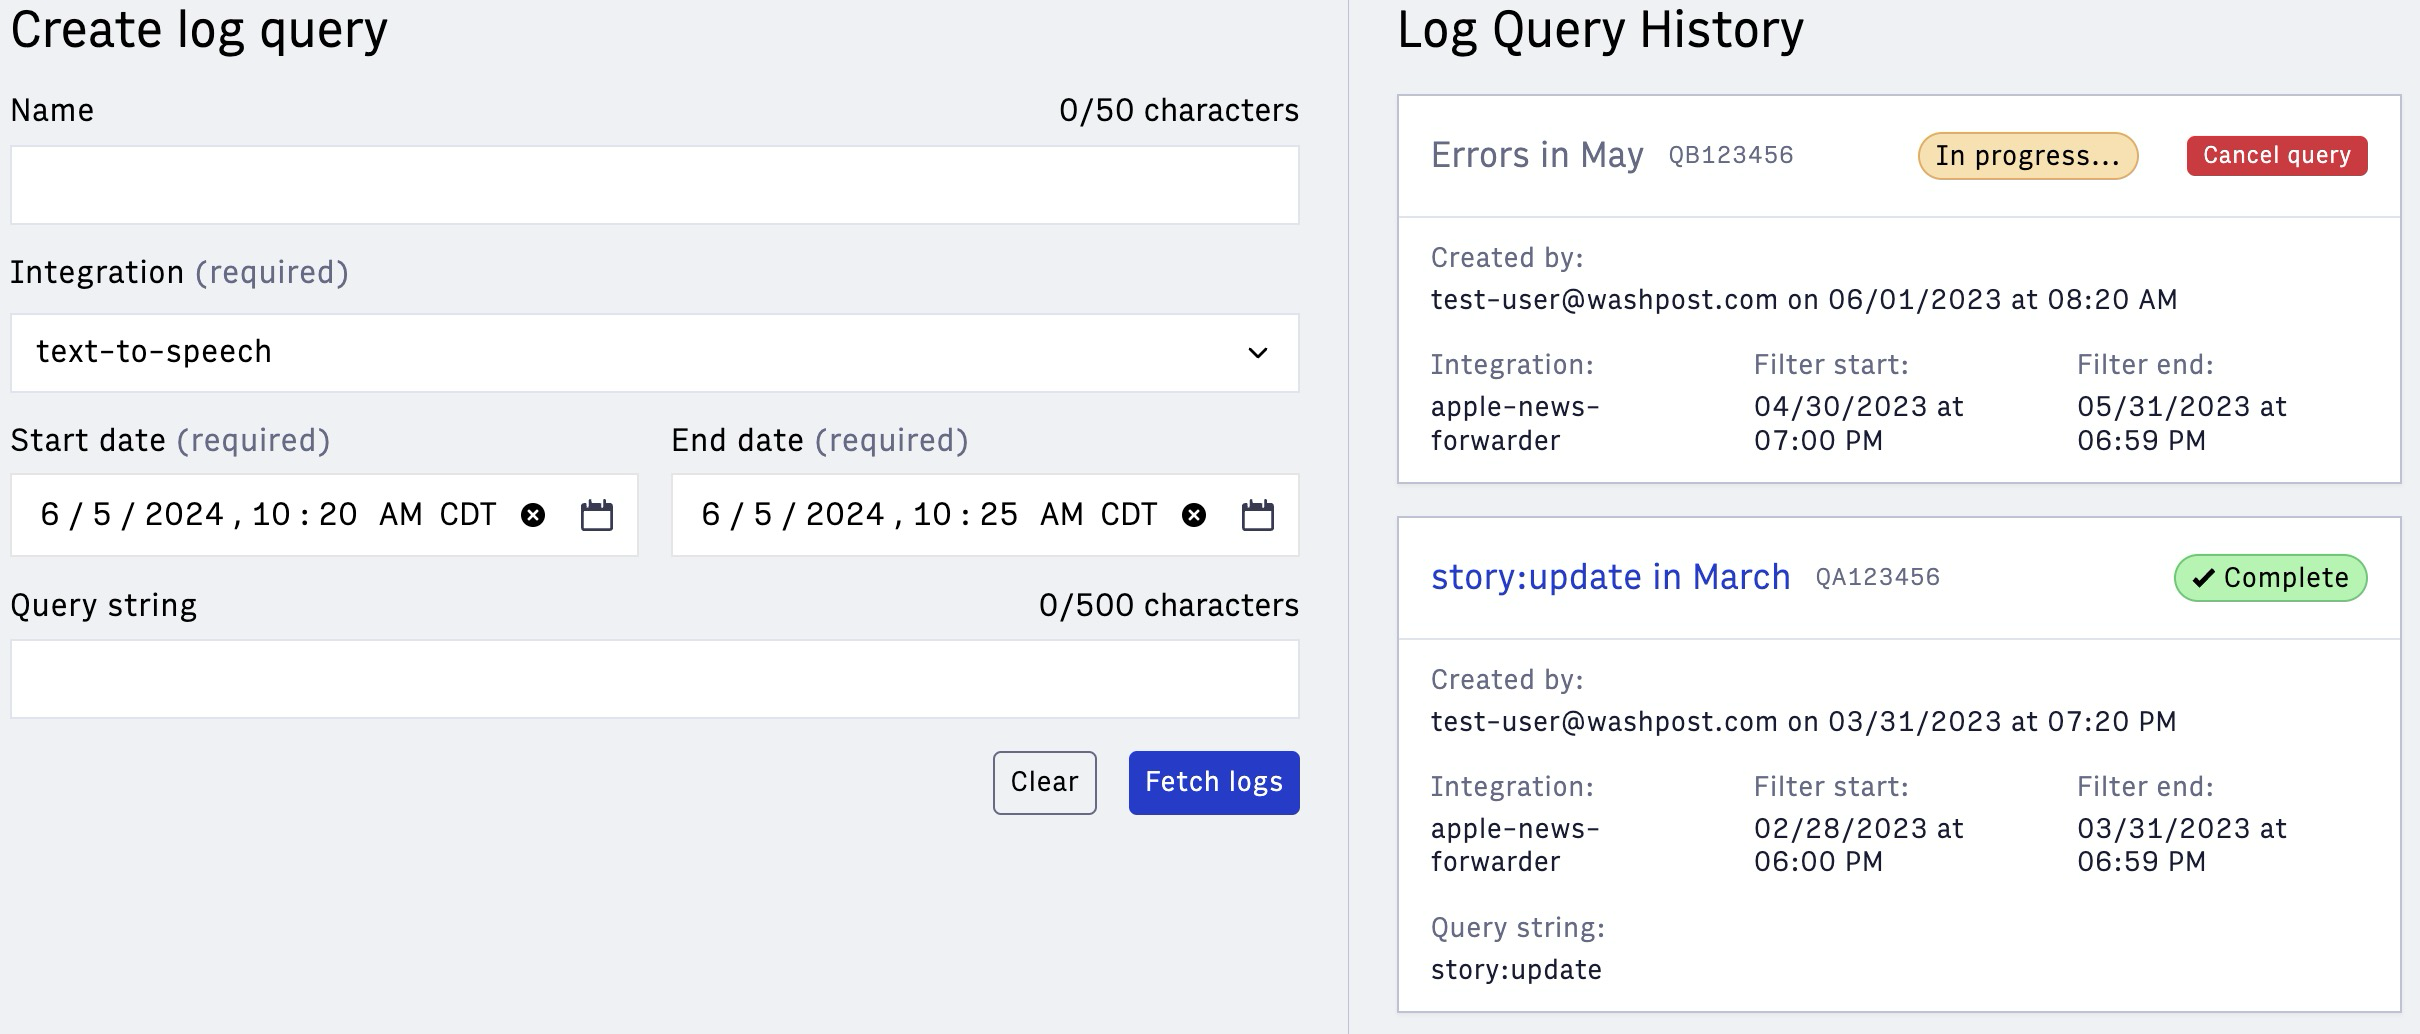
To access this interface, visit Arc XP’s Admin UI and look for a tile on the homepage for IFX. Within this section, you will be able to use this UI to provide criteria for which you need to search the logs. These log queries will be stored for you to easily access them as needed.
How to create a log query
Creating a log query is as simple as setting a start and end date for a specific integration and waiting a moment for the results to pour in. You can optionally give your log query a name, which can be handy if you expect to revisit the query later or there a lot of queries being made at the same time.
You can optionally provide Query String if you’d like to narrow your search. If you leave that field blank, IFX will execute a wild card search and return all of the integration logs for the specified time frame. The text search is case-sensitive.
How to view your logs
Once you’ve created a log query by following the steps above, IFX will collect the logs you’ve requested and add the query to the panel that appears on the righthand side of the page. Click on the named query (if you gave it a name), which will appear at the top of the list. From there, you’ll be taken to the logs detail page where you can review your logs.
FAQ
Is there anything I need to do to get stared with the new log experience?
It is automatically available to your organization.
Will this cost me more money?
No. This is offered to our customers as part of the product.
What if I have any questions or issues with my logs?
Submit a support ticket and we will be happy to look into it.
How do I let you know if I have an idea for an improvement or a suggestion?
Your feedback is important to ensure we are providing features that give you the most value. If you have ideas or suggestions, please add them to our Ideas Portal.