How To Troubleshoot Issues Across Multiple Experiences
Your developer team needs to understand and have added layer of context when troubleshooting issues with multiple Micro Experiences powering your sites. In your current single-experience operation model, it’s simple to know that there is single codebase powers all sites, single set of routing configuration (resolvers, content redirects, redirects UI) that all of a sudden becomes fragmented and this can add extra overhead for your team to manage when debugging, troubleshooting.
But there is a simple principle to think about when growing from single experience model to multiple experience model. And that is, always starting from the URL of the request, down to first knowing “which MX is responsible to render this web page”. Essentially multiple-experiences are configured using MX Service configuration using site and path mappings that is the most outer layer of your new multi-experience model. What this means is, every URL first matches with an experience using this configuration.
Here is the high-level routing journey of a URL your reader requests:
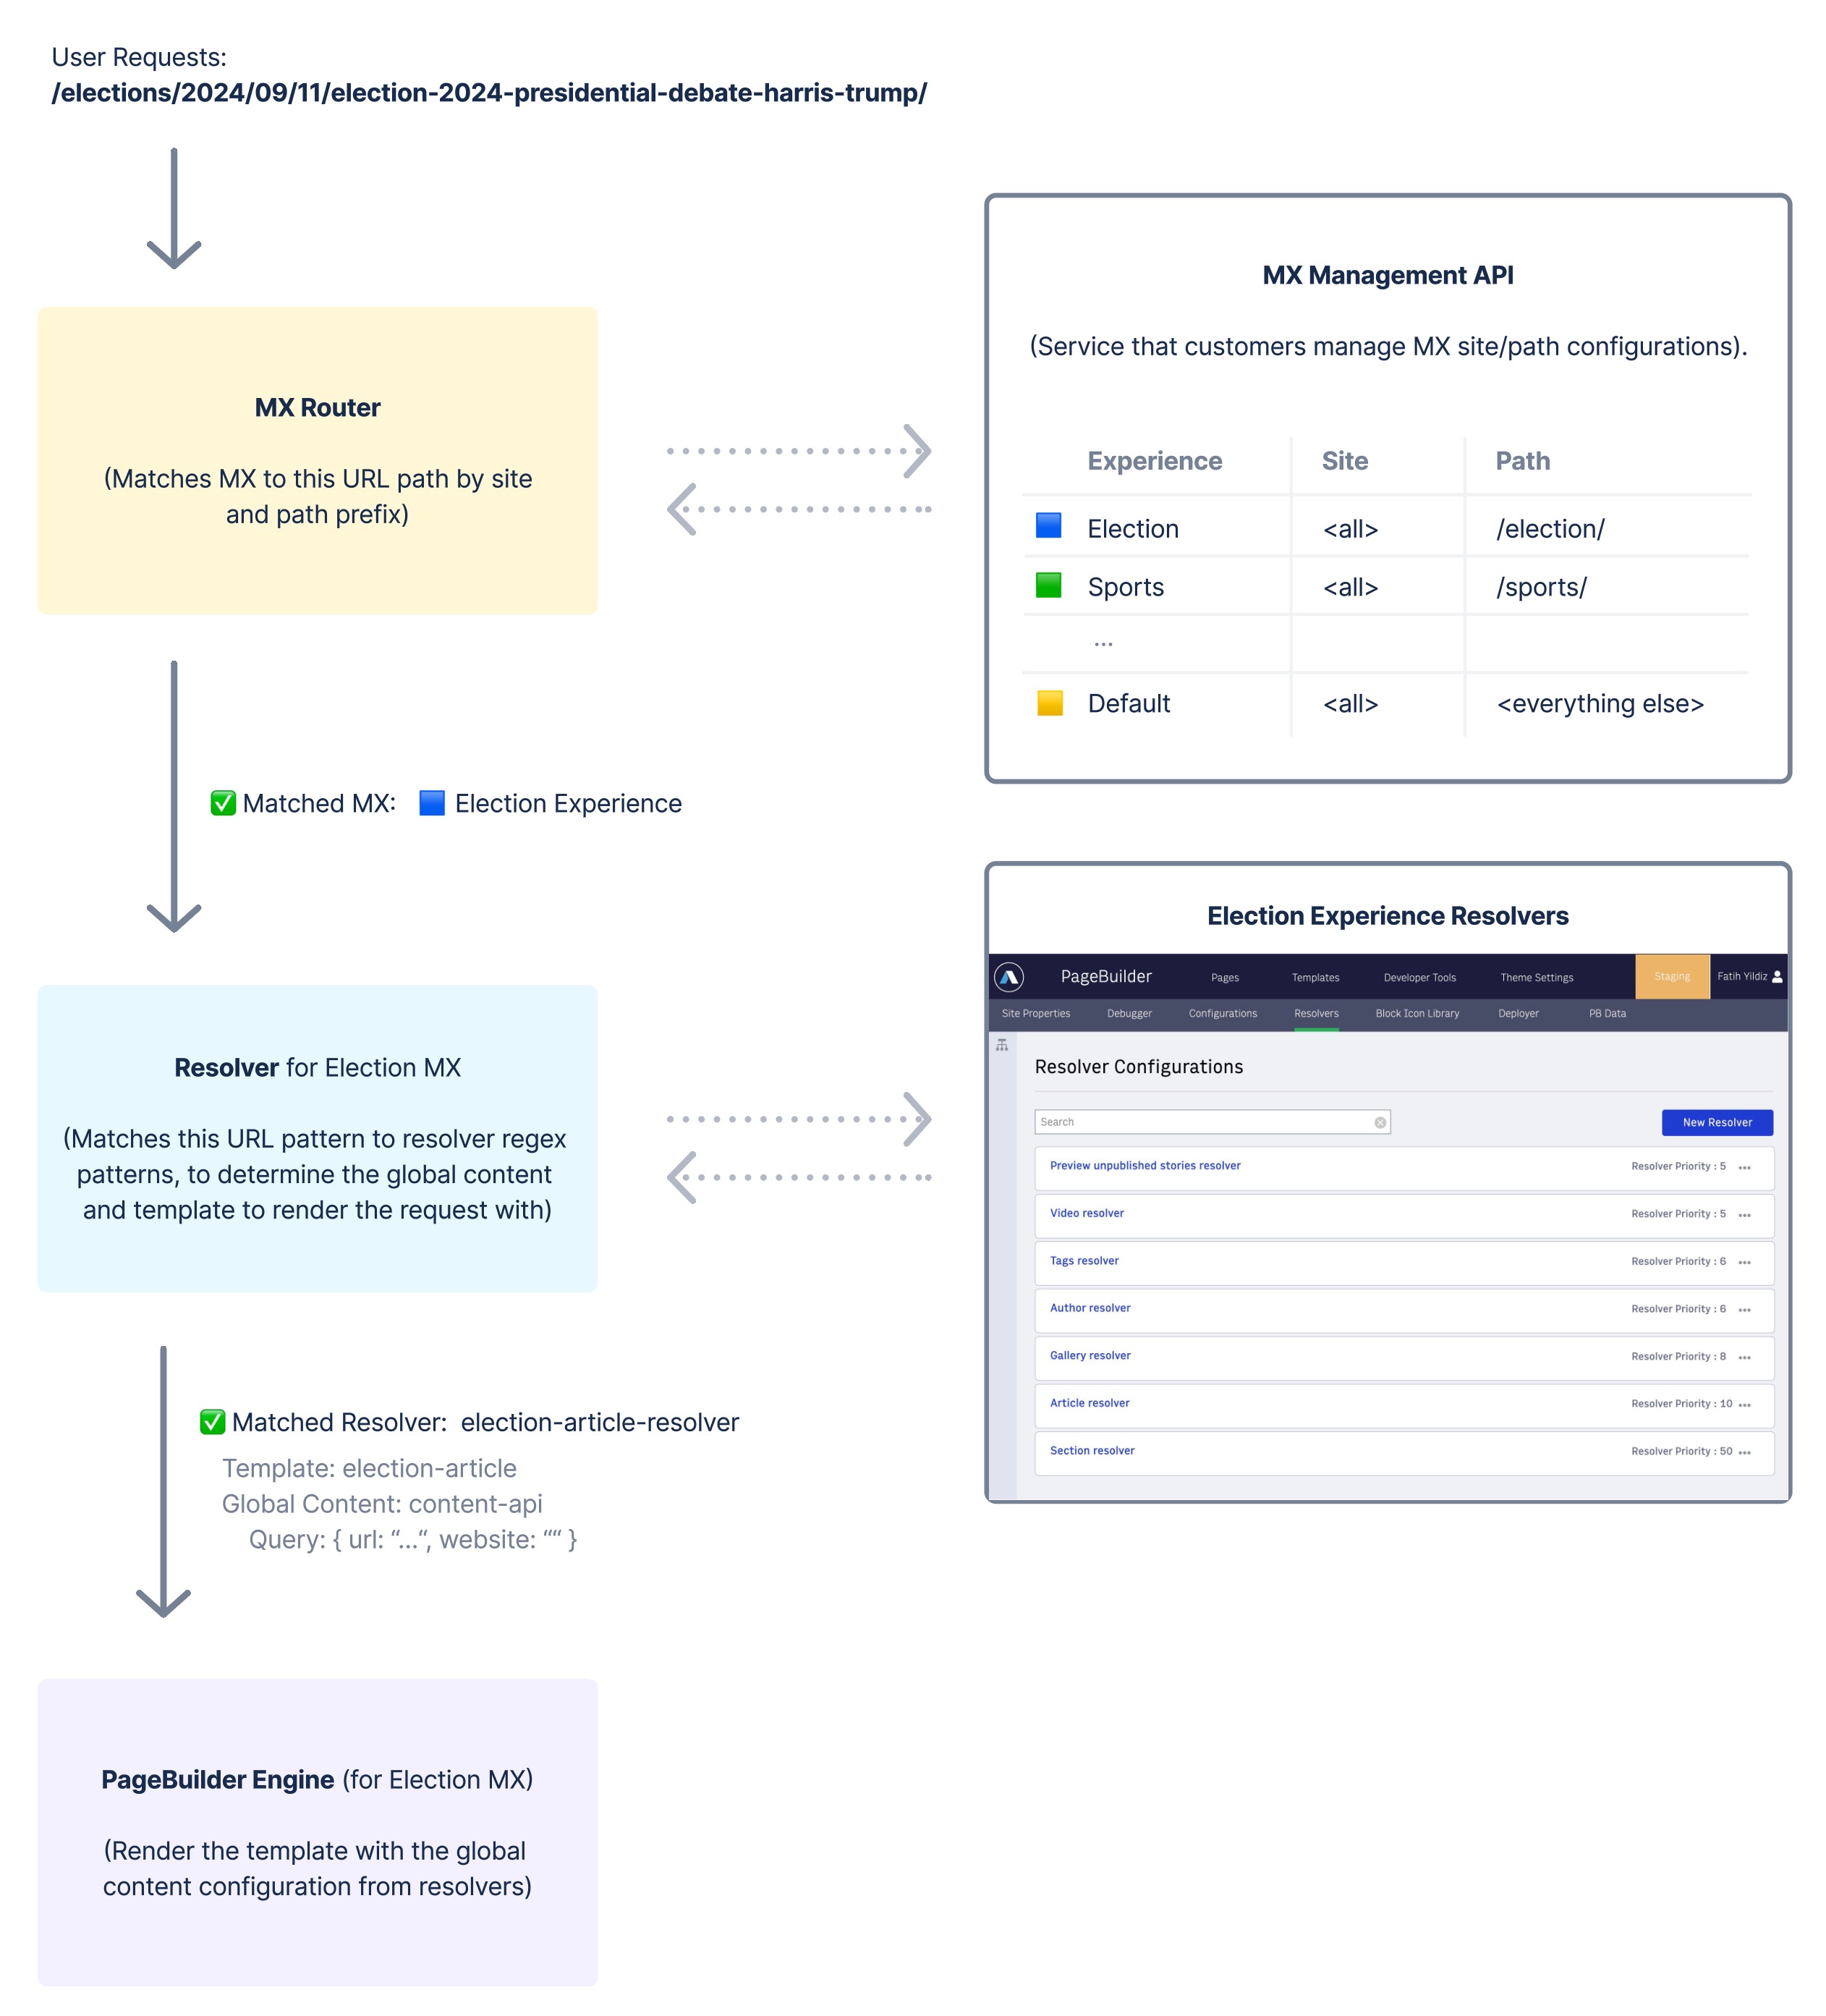
Once you know how your MXes are configured and how any given URL maps to an MX, you will be able to navigate and troubleshoot issues just like how you do it today, because after the MX is known, rest of the tooling and methods for troubleshooting is exactly same how we troubleshoot issues in single-experience.
Knowing a URL’s responsible MX is really depending on your MX configurations. If, let’s say you have 3 MX, first one default, second one is mapped to any website, any URL starting with /sports and the third one is any URL in siteX.com. it’ll be really simple for your developer team to navigate even without using any debugging tool for the first step. They could just go in to related MX and continue their troubleshooting. But what if you have more complex multi-site setup or site/path mappings that are not as simple as the example above.
We have a dedicated how to guide: How to identify which MX renders a page that provides 2 methods to identify a page’s MX id as a starting point in your troubleshooting journey.
Once you know the MX, rest is pretty simple, unchanged developer experience for your team. Below, we’ll cover the small nuances how existing debugging tools and experiences are changed, providing that additional MX context.
Debuggers
Resolver Debugger
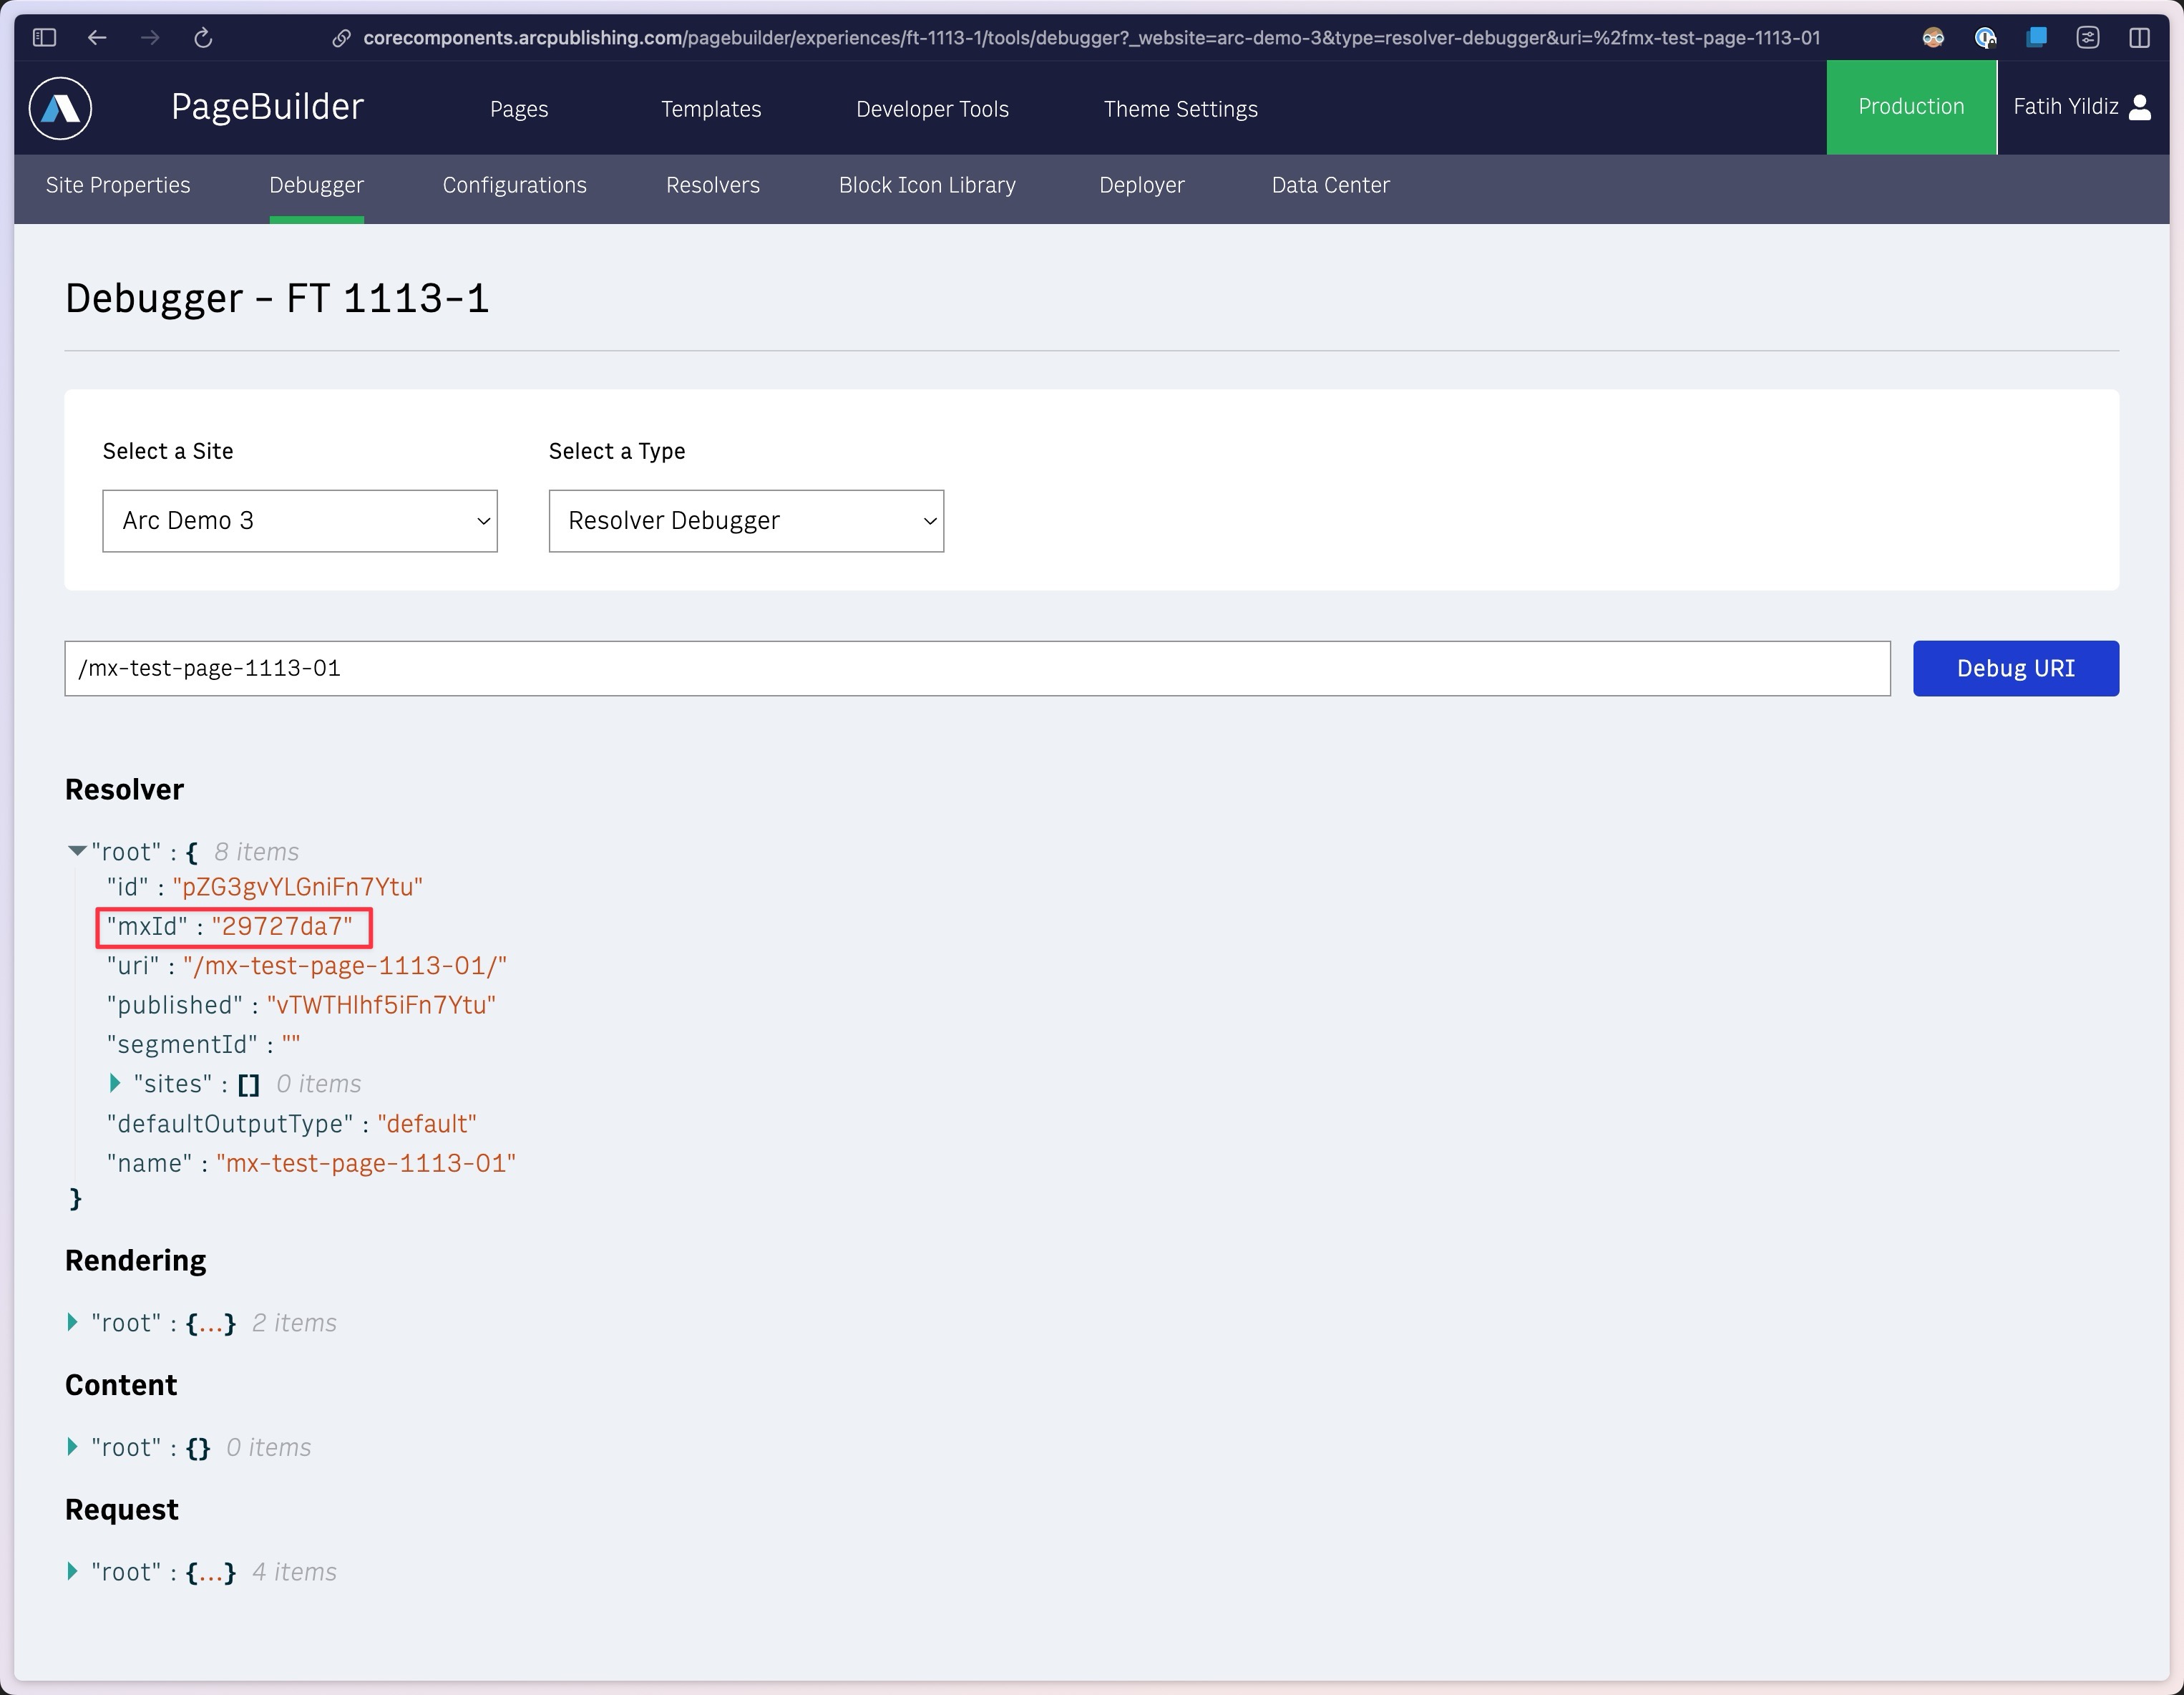
Resolver debugger works globally. It means it will resolve and help you troubleshoot any URL for that site regardless of the experience you selected. It will display the MX ID for the experience you are debugging.
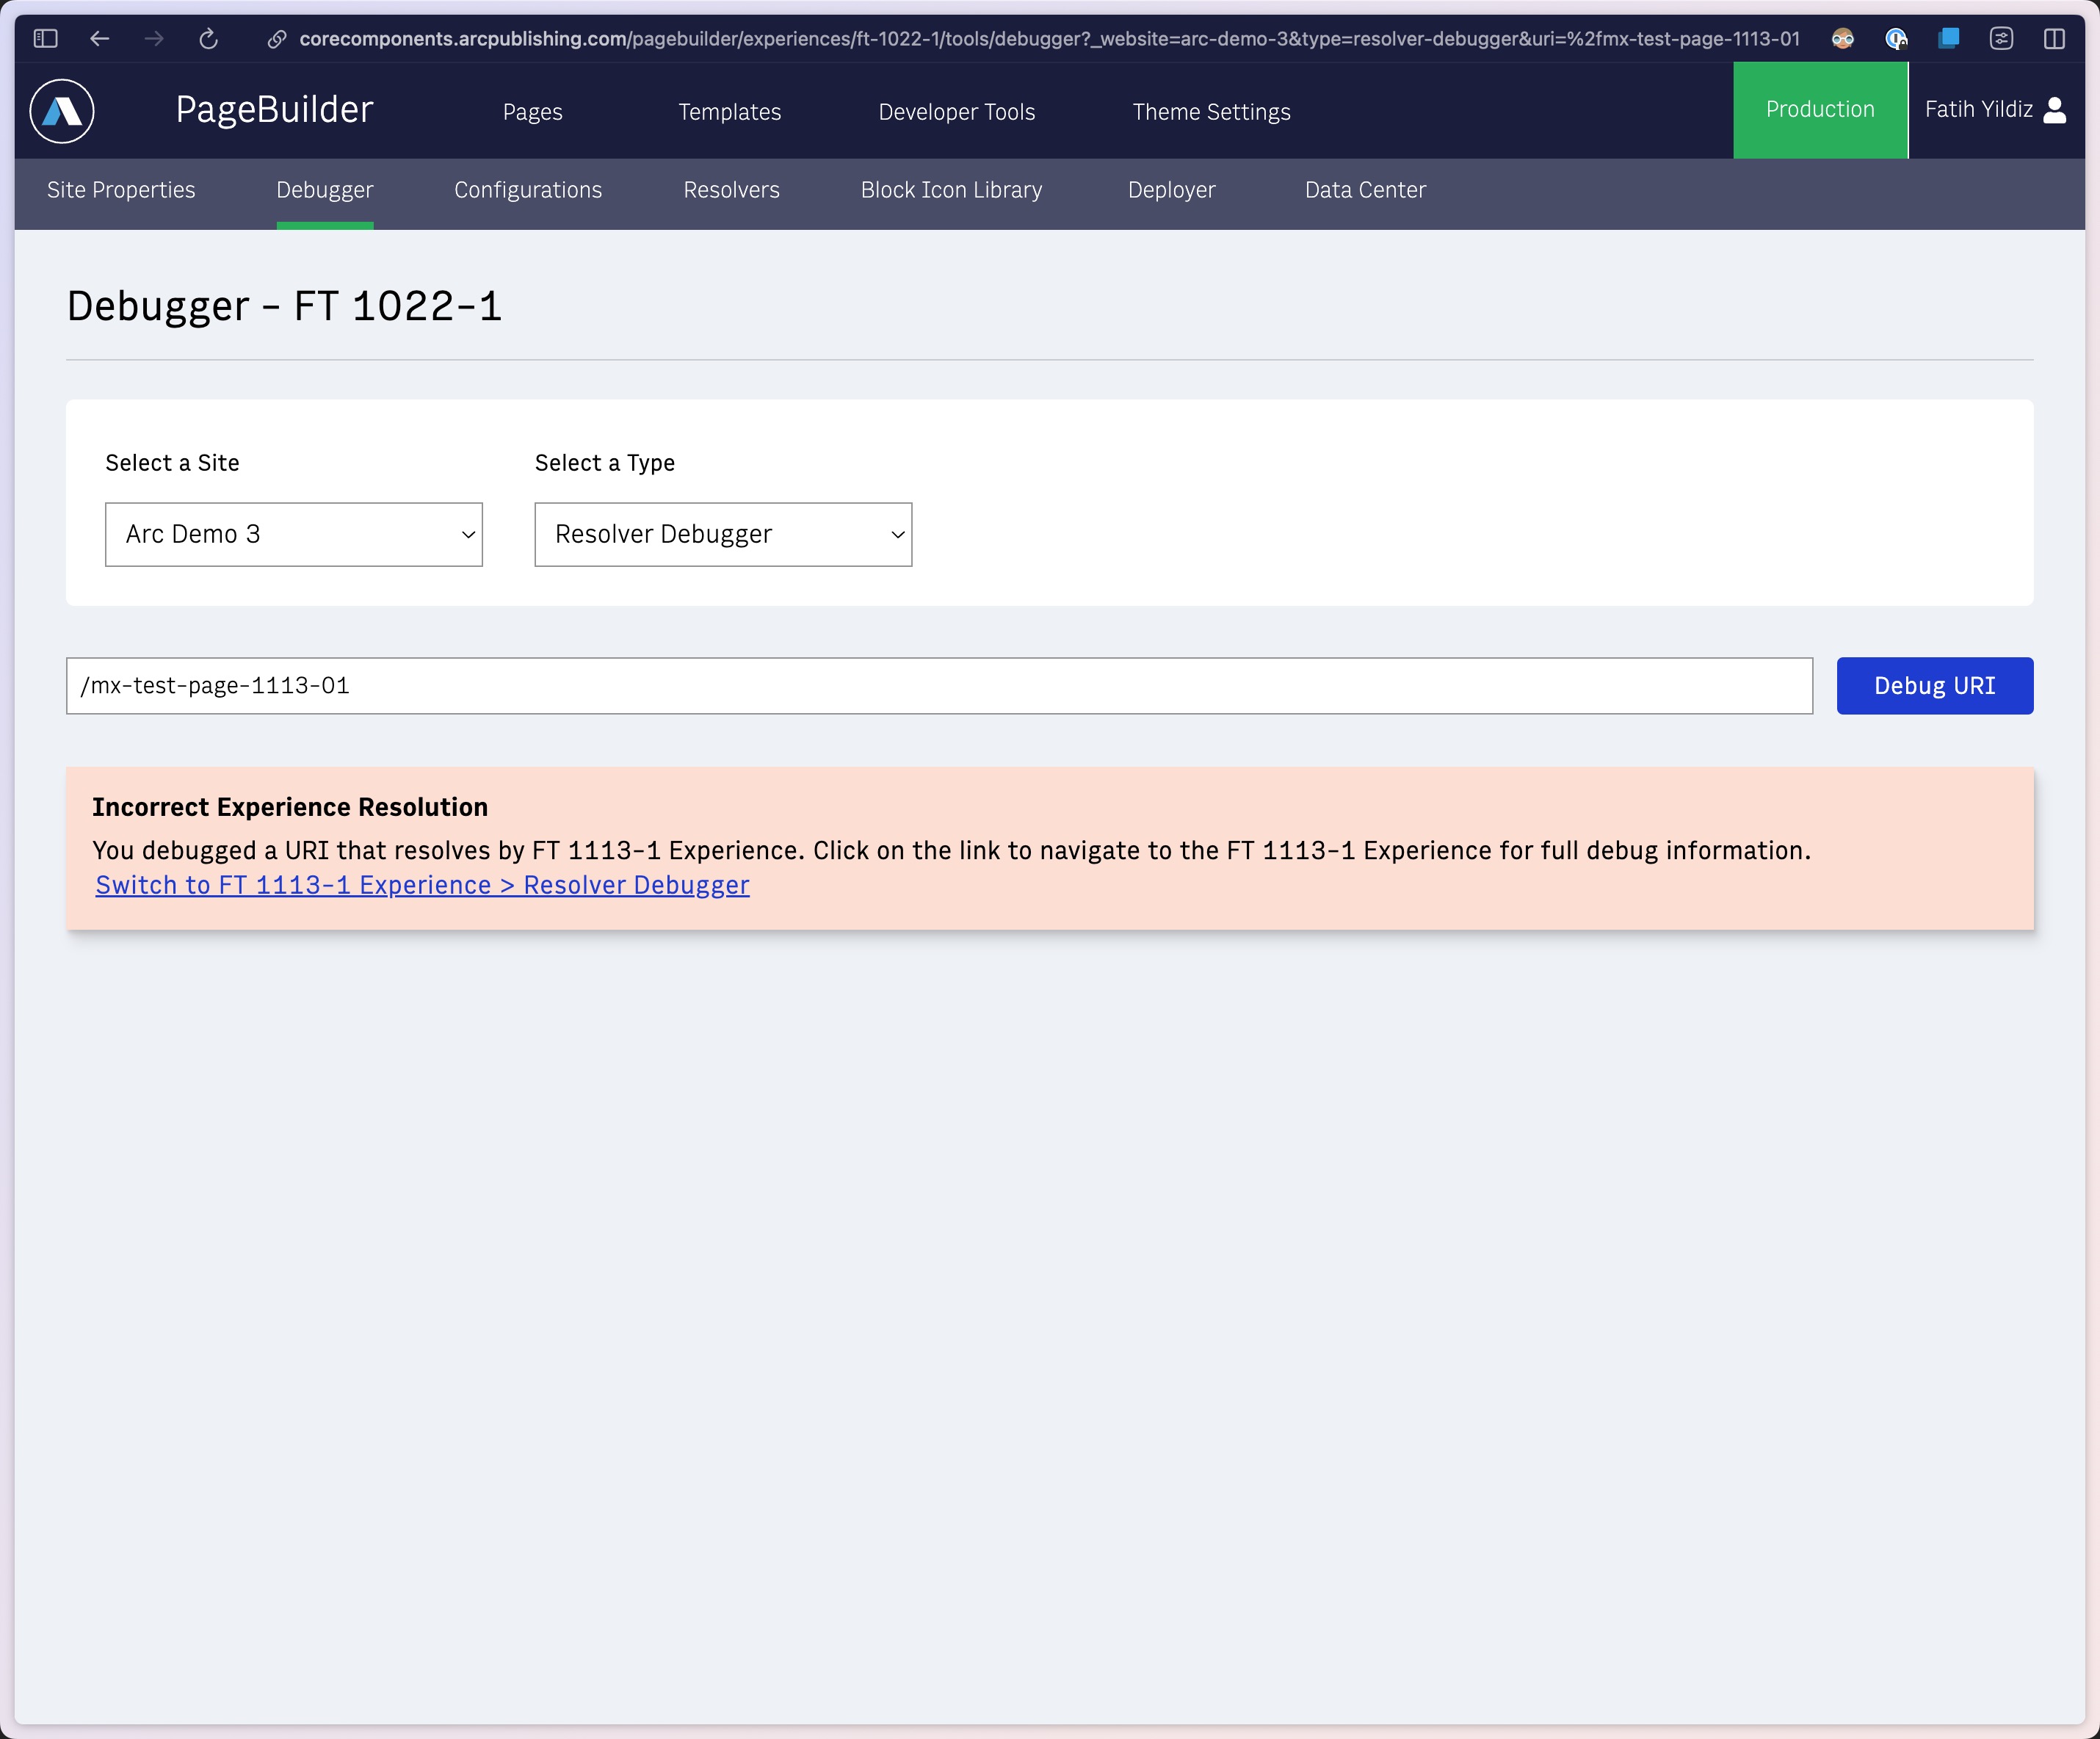
Also, if the URI you debugged belongs to another experience different than what you are currently in, it will warn you and help you navigate to the correct MX:
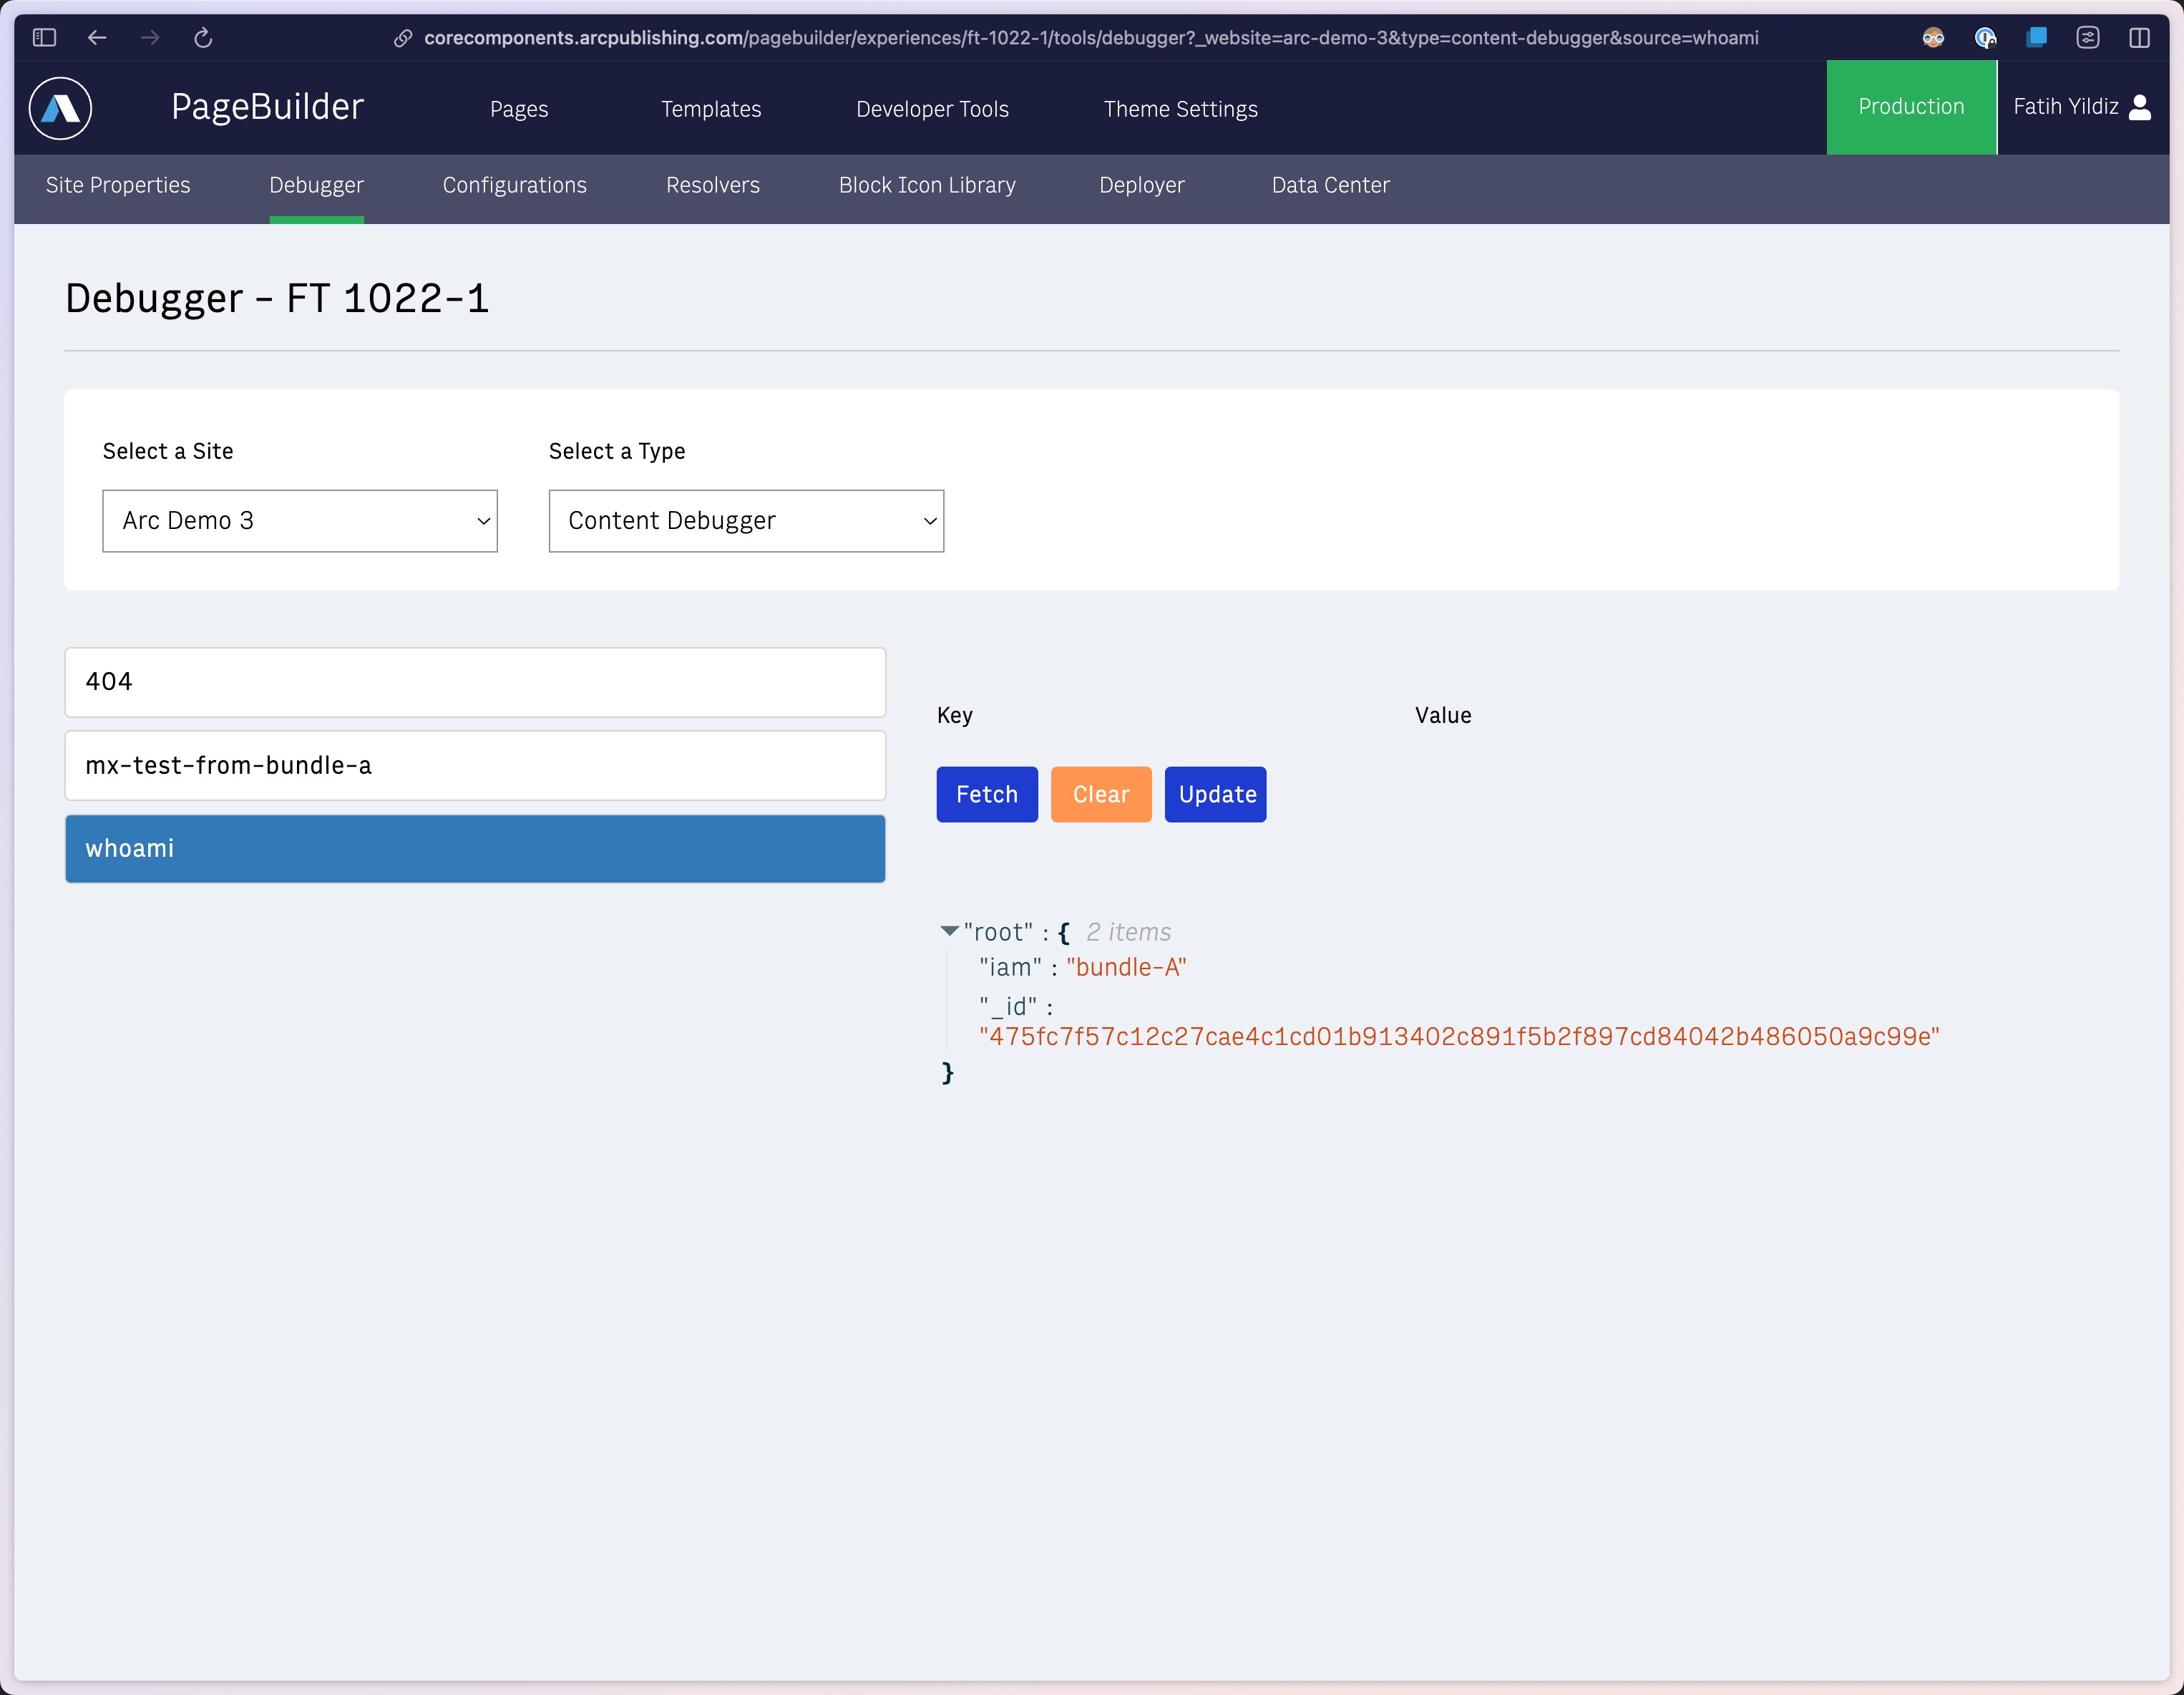
Content Source Debugger
Content source debugger will show content sources, only from the experience you are currently in. If you are in the Sports MX, you’ll only see list of content sources from Sports bundle.
PB Render Dashboard
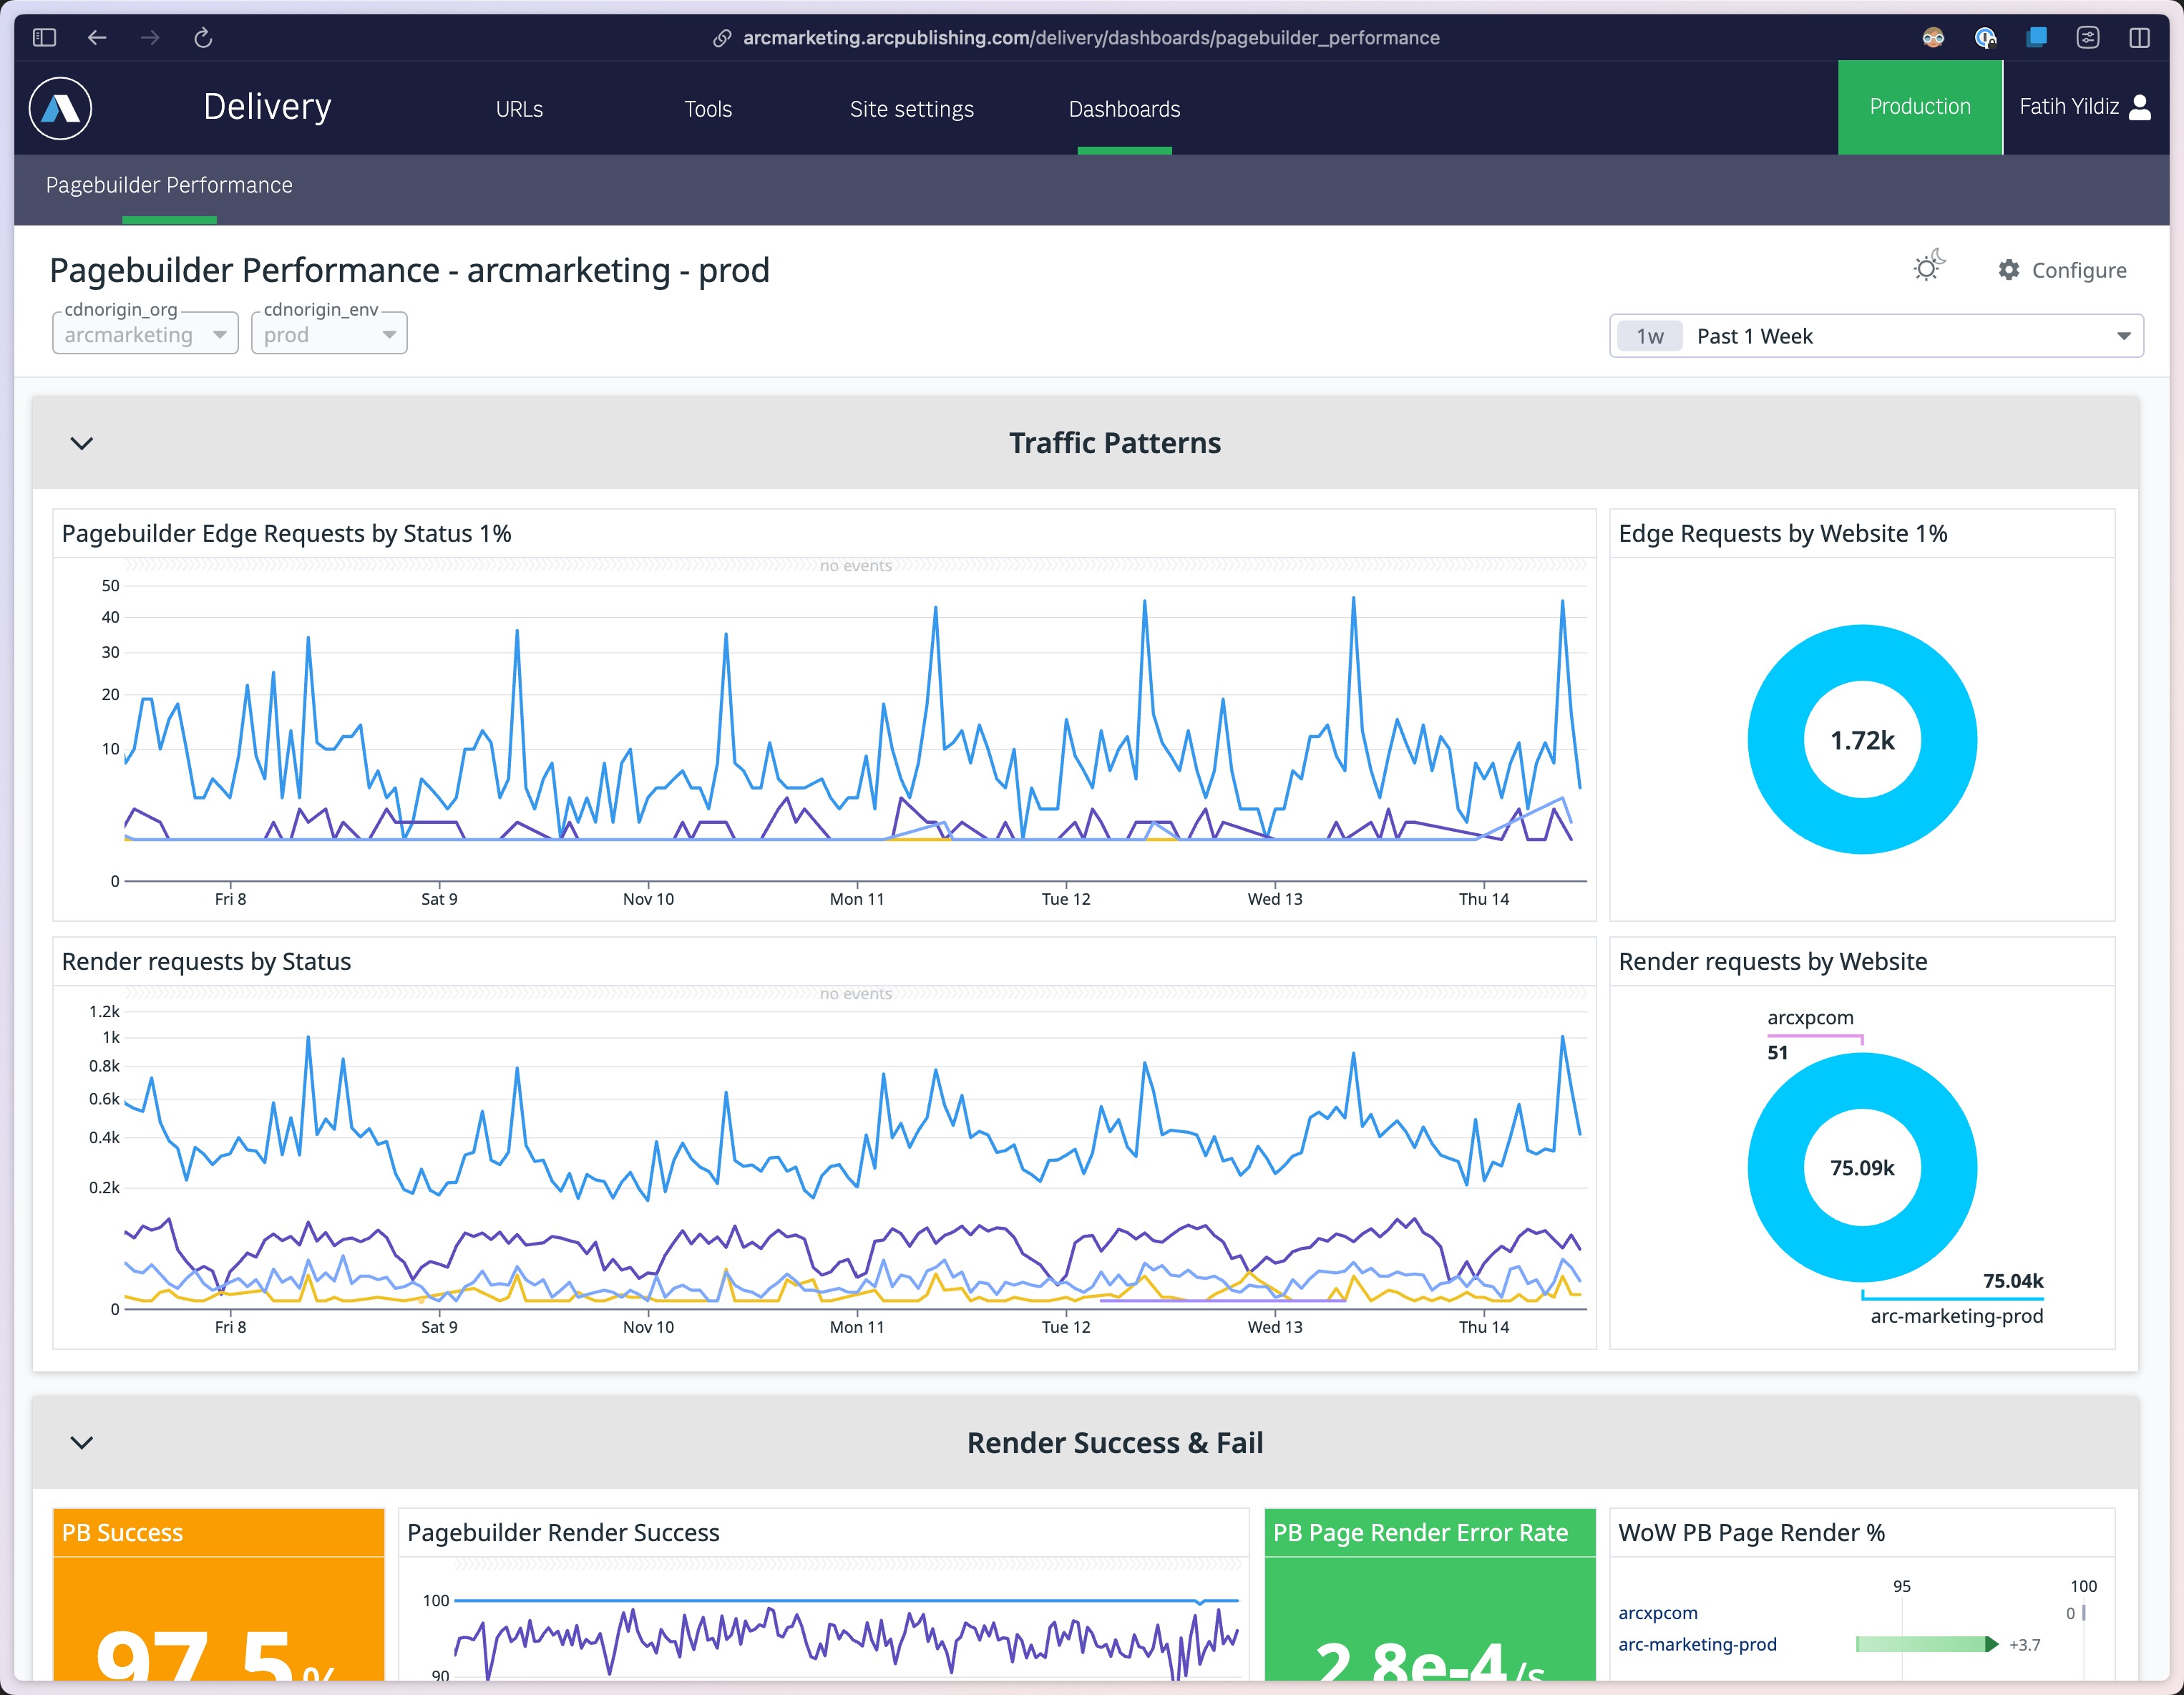
The PageBuilder Render Dashboard displays combined performance metrics from all your Micro Experience (MX) instances, offering a high-level overview of your platform’s performance.