If you’ve ever hit a weird 500 error or noticed a block rendering blank for no obvious reason, you know the pain of debugging in the dark. In this post—and in the video walkthrough—we’ll dig into a new CLI command we just released: view-logs.
It’s a lightweight but powerful tool to help you peek into the server-side logs for any page or feature in your Arc XP site. Let’s dive in.
▶️ Prefer to watch instead? Check out the full video tutorial right here:
Why Logs Matter
When things break in production, browser tools alone won’t help you much. Local doesn’t always replicate what’s really happening. You need to understand what went wrong in the server-side render; and that usually means logs.
Before this, getting logs meant setting up forwarding, managing log aggregation, or opening support tickets. Now? You can get what you need with a single CLI command. No infrastructure, no dashboards. Just run it locally and get the logs you care about.
Setting Up the CLI
If you haven’t already installed the Arc XP CLI, start with:
npm install -g @arcxp/cliThen, grab a developer token from the Developer Center and drop it into the .env file the CLI uses. Once that’s set, you’re good to go.
How view-logs works
The CLI command needs a request ID to fetch logs from a specific server-side render session. You’ll find this ID in the x-arc-pb-request-id response header of any full-page request.
Grab request-id from the browser:
- Open DevTools → Network tab
- Filter by “Document”
- Look at the headers of the page request
- You’ll see one or two request IDs—use the first one (that’s the render engine)
Then, just run:
arcxp view-logs --request-id <your-request-id>And boom—you get the full render logs for that page load.
See Arc XP CLI: PageBuilder Engine Logs documentation for more information.
Only recent logs (render happened in the last 15 minutes)
The view-logs command only queries logs from last 15 minutes window. This covers Arc XP’s default TTLs, so most request ids you’ll copy from a page will be valid, but for customers who have custom TTLs, or in the scenario that CDN serves stale content (due to a bug you may introduce or underlying APIs fail, that results render failures), your readers don’t get affected but they get served with a stale page, which the request id might be older than this window. In that case, no log lines will be found.
How to get a fresh render triggered?
You can append page, or content source (API) urls with token query string parameter to enumerate and bypass CDN cache and trigger a page render. This will help you to get fresh logs generated for a render session. Example:
https://mysite.com/sports?token=1234 will be treated separately than https://mysite.com/sports at CDN cache and trigger a page render. Then the request-id header you can obtain from the fresh render should provide render logs for your troubleshooting purposes.
Common Scenarios You’ll Want to Use This For
Now, let me show you a few real-world issues where this is super helpful.
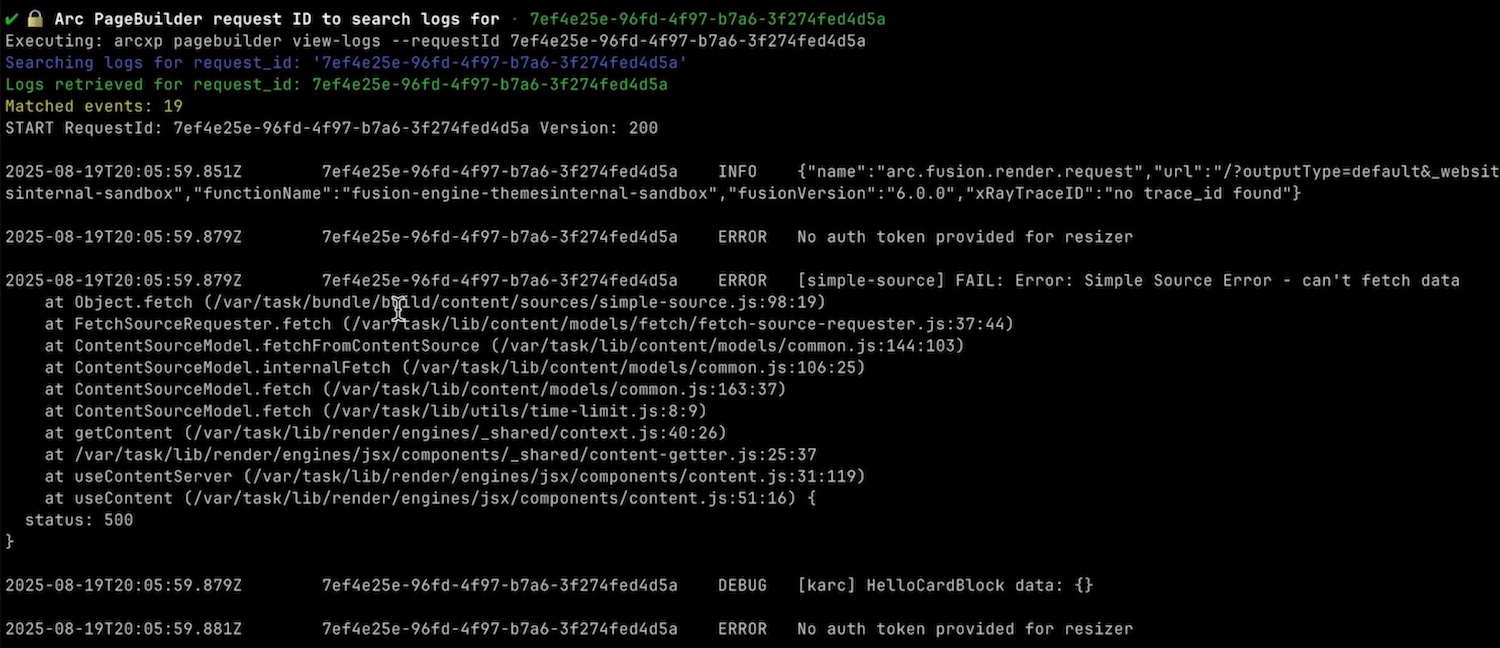
1. You’re Getting a 500 Error
You deploy a change. Your /sports page throws a 500. Browser doesn’t help. CLI to the rescue.
Pull the request ID from the page load, run view-logs, and check out the stack trace. Most of the time it points directly to the file and line where something blew up—like a bad fetch call, undefined prop, or content source error.
2. A Block is Rendering Blank
This one’s subtle. The page loads, but a block just… isn’t there. No error. No message. You even see it fine in preview.
Behind the scenes, something probably failed silently in the server-side render. Using view-logs, you can trace the issue—maybe a failed content source, or a bug that caused a React tree to unmount.
Once you find it in logs, you’ll know exactly what to fix.
3. Content Isn’t Updating (Stale Page)
Your content team just published updates, but the live site still shows the old version. Most of the time, this is a caching issue. But sometimes it’s deeper.
Force a fresh render using ?token=123, grab the new request ID, and inspect the logs. Was the new content actually fetched? Did the render context match what you expected?
This helps you pinpoint whether it’s a cache config issue, a bug in the data layer, or something else.
You can use this command against internal preview URLs, pre-production domains, or even production environments. It works whether you’re testing new bundle deployments or debugging something that’s already live.
Just make sure you grab the right request ID, make sure your CLI credentials match with the environment you’re checking logs from, and run the view-logs command.
The view-logs command gives developers the observability they need—without the overhead. It’s CLI-first, easy to use, and designed to integrate directly into your debugging flow.
Let us know what you think. And if there’s something else you’d like to see added to the CLI, we’re listening.